PROBLEM STATEMENT
KPI’s REQUIREMENT
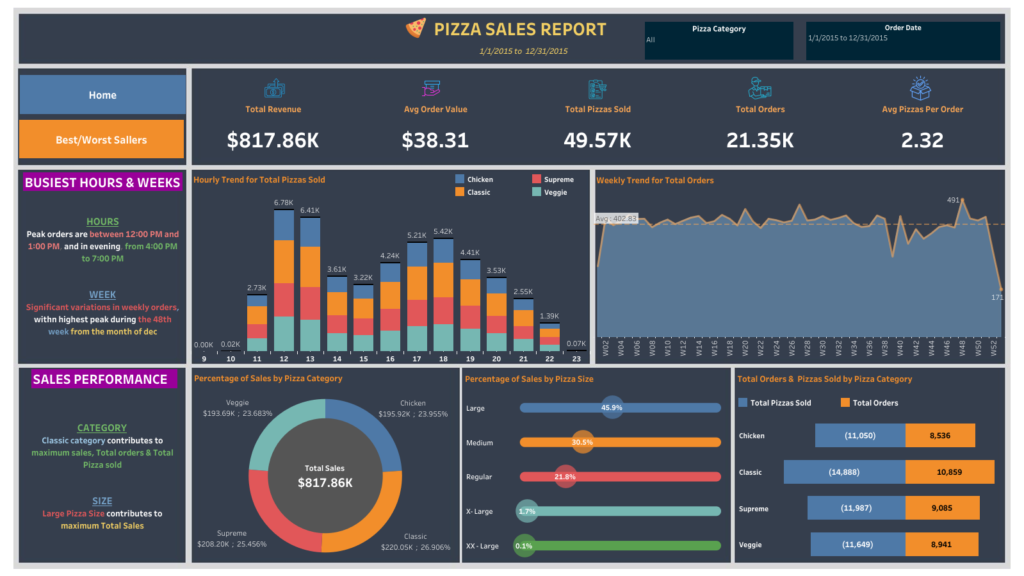
We need to analyze key indicators for our pizza sales data to gain insights into our business performance. Specifically, we want to calculate the following metrics:
- Total Revenue: The sum of the total price of all pizza orders.
- Average Order Value: The average amount spent per order, calculated by dividing the total revenue by the total number of orders.
- Total Pizzas Sold: The sum of the quantities of all pizzas sold.
- Total Orders: The total number of orders placed.
- Average Pizzas Per Order: The average number of pizzas sold per order, calculated by dividing the total number of pizzas sold by the total number of orders.
CHARTS REQUIREMENT
We would like to visualize various aspects of our pizza sales data to gain insights and understand key trends. We have identified the following requirements for creating charts:
- Hourly Trend for Total Pizzas Sold : Create a stacked bar chart that displays the hourly trend of total orders over a specific time period. This chart will help us identify any patterns or fluctuations in order volumes on a hourly basis.
- Weekly Trend for Total Orders : Create a line chart that illustrates the weekly trend of total orders throughout the year. This chart will allow us to identify peak weeks or periods of high order activity.
- Percentage of Sales by Pizza Category : Create a pie chart that shows the distribution of sales across different pizza categories. This chart will provide insights into the popularity of various pizza categories and their contribution to overall sales
- Percentage of Sales by Pizza Size: Generate a pie chart that represents the percentage of sales attributed to different pizza sizes. This chart will help us understand customer preferences for pizza sizes and their impact on sales
- Total Pizzas Sold by Pizza Category : Create a funnel chart that presents the total number of pizzas sold for each pizza category. This chart will allow us to compare the sales performance of different pizza categories.
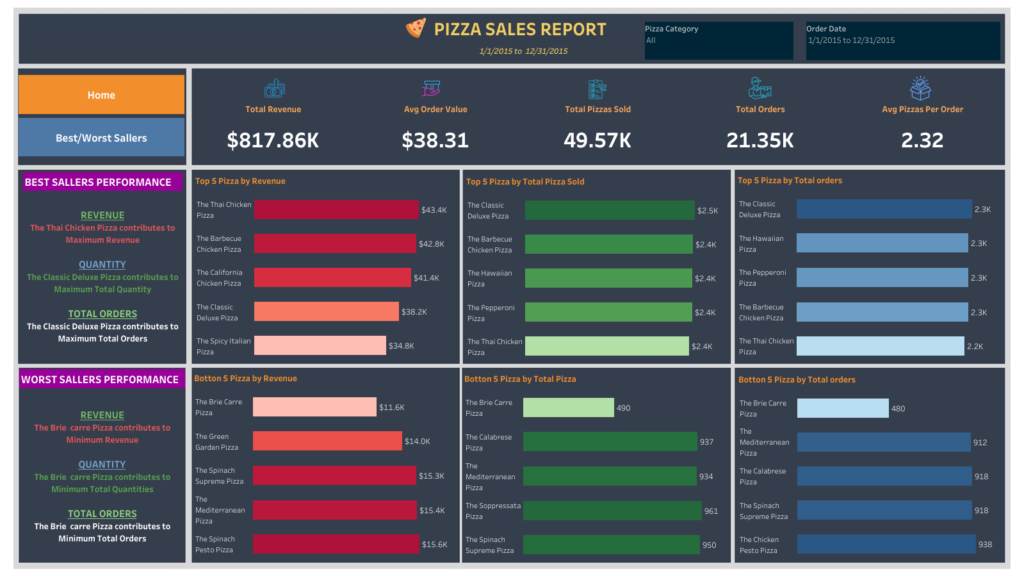
- Top 5 Best Sellers by Revenue, Total Quantity and Total Orders : Create a bar chart highlighting the top 5 best-selling pizzas based on the Revenue, Total Quantity, Total Orders. This chart will help us identify the most popular pizza options
- Bottom 5 Best Sellers by Revenue, Total Quantity and Total Orders : Create a bar chart showcasing the bottom 5 worst-selling pizzas based on the Revenue, Total Quantity, Total Orders. This chart will enable us to identify underperforming or less popular pizza options
Data Exploration with SQL
--############ KPI’s REQUIREMENT ################

--1. Total Revenue: The sum of the total price of all pizza orders.

SELECT SUM(total_price) AS Total_Revenu
  FROM [Pizza_DB].[dbo].[pizza_sales]

--2. Average Order Value: The average amount spent per order, calculated by dividing the total revenue by the total number of orders.

SELECT SUM(total_price)/COUNT(DISTINCT order_id) as Average_Order_Value
	FROM [Pizza_DB].[dbo].[pizza_sales]

--3. Total Pizzas Sold: The sum of the quantities of all pizzas sold.
SELECT SUM(quantity) as[Total Pizzas Sold]
	FROM [Pizza_DB].[dbo].[pizza_sales]

--4. Total Orders: The total number of orders placed.
SELECT COUNT(DISTINCT order_id) as[Total Orders]
	FROM [Pizza_DB].[dbo].[pizza_sales]

--5. Average Pizzas Per Order: The average number of pizzas sold per order, calculated by dividing the total number of pizzas sold by the total number of orders.

SELECT CAST (CAST(SUM(quantity) as decimal(10,2))/CAST (COUNT(DISTINCT order_id)as decimal(10,2)) as decimal(10,2)) as [Average Pizzas Per Order]
	FROM [Pizza_DB].[dbo].[pizza_sales]

--- ######CHARTS REQUIREMENT #############

-- 1. Hourly Trend for Total Pizzas Sold:
SELECT DATEPART(HOUR, order_time) as [Order Hour], SUM(quantity) as [Total Pizzas Sold]
	FROM [Pizza_DB].[dbo].[pizza_sales]
	GROUP BY  DATEPART(HOUR, order_time)
	ORDER BY  DATEPART(HOUR, order_time)
--1. Weekly(ISO) Trend for Total Orders
SELECT DATEPART(ISO_WEEK, order_date) as [Order Week], COUNT(DISTINCT order_id) as [Total Orders]
FROM [Pizza_DB].[dbo].[pizza_sales]
GROUP BY DATEPART(ISO_WEEK, order_date)
ORDER BY DATEPART(ISO_WEEK, order_date)
--2. Weekly(Standard) Trend for Total Orders
SELECT DATEPART(WEEK, order_date) as [Order Week], COUNT(DISTINCT order_id) as [Total Orders]
FROM [Pizza_DB].[dbo].[pizza_sales]
GROUP BY DATEPART(WEEK, order_date)
ORDER BY DATEPART(WEEK, order_date)
--3.Percentage of Sales by Pizza Category
SELECT pizza_category, (SUM(total_price)*100/(SELECT SUM(total_price) FROM [Pizza_DB].[dbo].[pizza_sales])) as Pecentage
FROM [Pizza_DB].[dbo].[pizza_sales]
GROUP BY pizza_category
--4. Percentage of Sales by Pizza Size
SELECT pizza_size, (SUM(total_price)*100/(SELECT SUM(total_price) FROM [Pizza_DB].[dbo].[pizza_sales])) as Pecentage
FROM [Pizza_DB].[dbo].[pizza_sales]
GROUP BY pizza_size
--5. Total Pizzas Sold by Pizza Category:
SELECT pizza_category, SUM(quantity) as [Pizzas Sold]
FROM [Pizza_DB].[dbo].[pizza_sales]
GROUP BY pizza_category
--6. Top 5 Best Sellers by Revenue, Total Quantity and Total Orders
SELECT TOP 5 pizza_name,SUM(total_price) as Revenue, SUM(quantity)as Quantity, COUNT(DISTINCT order_id ) as [Total Orders]
FROM [Pizza_DB].[dbo].[pizza_sales]
GROUP BY pizza_name
ORDER BY Revenue DESCDashBoards with Tableau
Please click here to explore the dashboard in Tableau Online


